What Is Technical Analysis?
Technical analysis is a method of evaluating securities by analyzing statistical trends in price and volume.
Unlike fundamental analysis, which focuses on a company’s financial health, technical analysis assumes that all relevant information is already reflected in the price of a security. Technical analysts believe that market trends and patterns can be identified and used to predict future price movements.
By studying historical price charts and trading volume, technical analysts look for recurring patterns and trends. These patterns can range from simple support and resistance levels to complex chart formations. Technical indicators, such as moving averages, relative strength index (RSI), and moving average convergence divergence (MACD), are also used to generate trading signals.
It’s essential to note that technical analysis is not a crystal ball. While it can provide valuable insights, it’s not foolproof. Markets can be unpredictable, and past performance is not indicative of future results. However, when used in conjunction with other analysis methods and risk management strategies, technical analysis can be a helpful tool for investors and traders.
How Technical Analysis Is Used
Technical analysis is employed to identify potential trading opportunities by examining past price and volume data.
Analysts use various tools and techniques to interpret market trends and patterns. One common approach is charting, where price and volume data are plotted over time to visualize trends, support and resistance levels, and chart patterns.
Technical indicators are mathematical calculations applied to price and volume data to generate signals about potential price movements. These indicators can range from simple moving averages to complex oscillators. Traders use these indicators to confirm trends, identify overbought or oversold conditions, and generate buy or sell signals.
Another crucial aspect of technical analysis is time frame analysis. By studying price charts at different time intervals (e.g., daily, weekly, monthly), traders can identify trends and patterns across various time horizons. This helps them to confirm or contradict signals from shorter-term charts and make more informed decisions.
Technical Analysis Indicators
Technical indicators are mathematical calculations applied to historical price and volume data to generate signals about potential price movements.

They provide traders with quantitative insights into market sentiment, momentum, and volatility. Some of the most widely used technical indicators include:
- Trend Indicators: These indicators help identify the direction of a price trend. Moving averages are a classic example, smoothing out price data to reveal underlying trends. Other trend indicators include the Directional Movement Index (DMI) and Parabolic SAR.
- Momentum Indicators: Momentum indicators measure the speed and change of price movements. The Relative Strength Index (RSI) and Stochastic Oscillator are popular choices. They help identify overbought or oversold conditions, potential trend reversals, and momentum divergences.
- Volatility Indicators: These indicators measure price fluctuations. Bollinger Bands, for instance, plot bands around a moving average to indicate price volatility. The Average True Range (ATR) is another commonly used volatility indicator.
It’s important to note that technical indicators should be used in conjunction with other analysis methods and not in isolation. They provide valuable information but don’t guarantee future price movements.
Underlying Assumptions of Technical Analysis
Technical analysis is built upon several key assumptions about market behavior. The first and perhaps most fundamental assumption is that market prices reflect all available information. This concept, known as the efficient market hypothesis, suggests that it’s impossible to consistently outperform the market by using publicly available information. Technical analysts believe that while this information is incorporated into prices, patterns and trends can still be identified to predict future price movements.
A second crucial assumption is that history tends to repeat itself. Technical analysts often search for recurring patterns in price charts, assuming that similar patterns will lead to similar price outcomes in the future. This assumption is based on the belief that market psychology and investor behavior tend to be consistent over time.
Finally, technical analysts assume that price and volume are the primary factors influencing security prices. They believe that all relevant information about a security is encapsulated in its price and trading activity. While fundamental factors like earnings and economic conditions can impact prices, technical analysts focus solely on price and volume data to make their predictions.
Fundamental Analysis Vs Technical Analysis
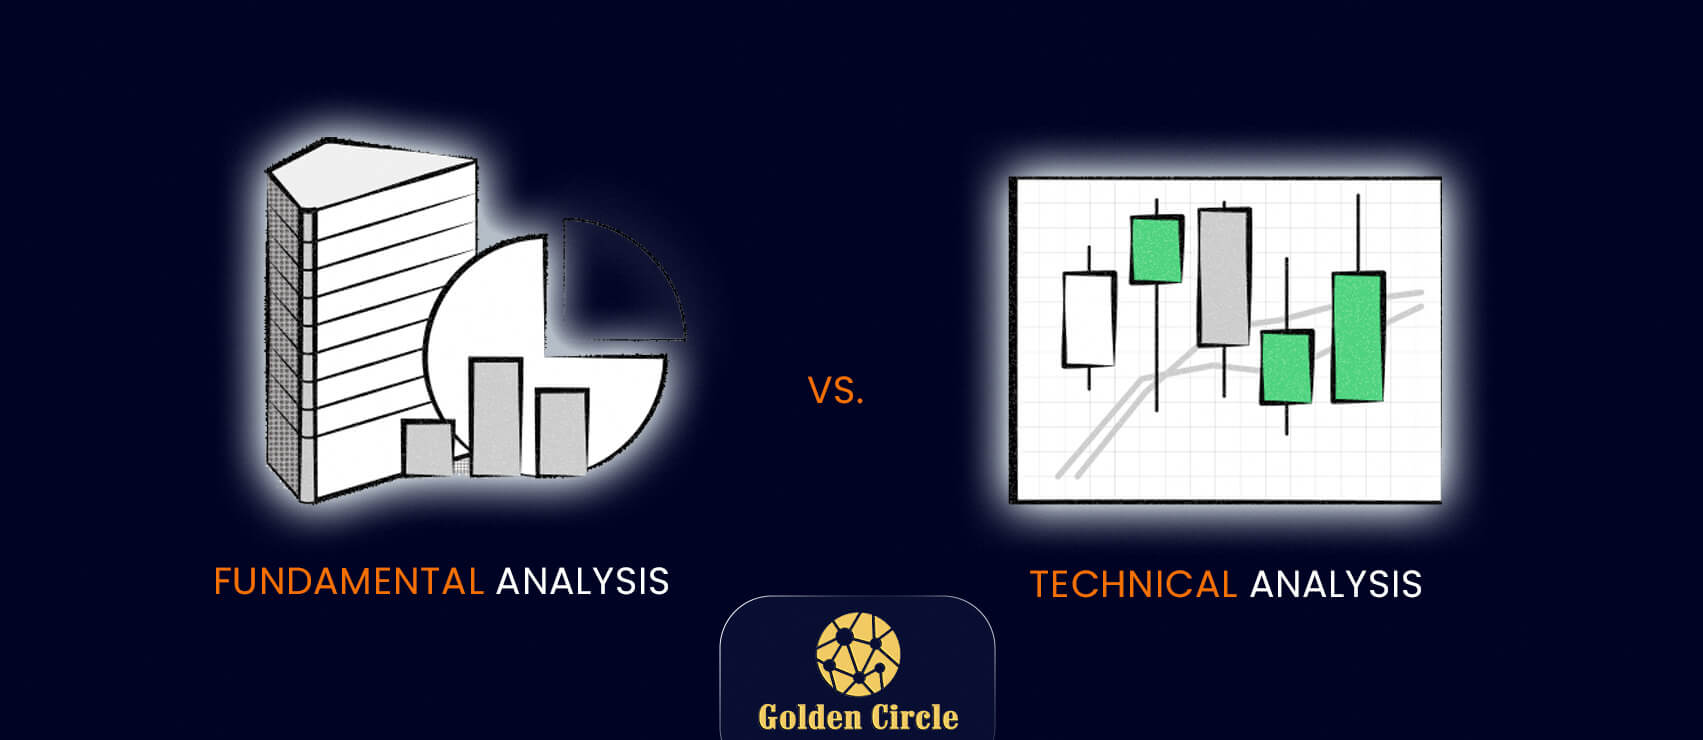
Fundamental analysis and technical analysis represent two distinct approaches to evaluating securities.

Fundamental analysis delves into a company’s financial health, economic conditions, and industry trends to determine its intrinsic value. Analysts scrutinize financial statements, such as income statements, balance sheets, and cash flow statements, to assess a company’s profitability, solvency, and growth prospects. The goal is to identify stocks that are undervalued or overvalued relative to their intrinsic worth.
In contrast, technical analysis focuses solely on the price and volume history of a security. Technical analysts believe that all relevant information about a stock is already reflected in its price. By studying charts and using various indicators, they attempt to identify patterns and trends that can predict future price movements. Technical analysis is often used to determine optimal entry and exit points for trades.
While fundamental and technical analysis may seem like opposing philosophies, many investors and traders use both approaches to inform their decision-making. Combining these methods can provide a more comprehensive view of a security’s value and potential price movements.
Limitations of Technical Analysis
Technical analysis, while a popular tool among traders, is not without its critics. One fundamental challenge stems from the Efficient Market Hypothesis (EMH). Proponents of the EMH argue that all available information is already reflected in a security’s price, rendering historical price and volume data useless for predicting future movements. In essence, if technical analysis works, then fundamental analysis should also be ineffective, a concept aligned with the weak and semi-strong forms of the EMH.

Another criticism centers on the assumption that market history repeats itself. Critics contend that price patterns are unpredictable and can be better modeled as a random walk. Relying on past price movements to forecast future trends, therefore, might be misguided.
A third limitation pertains to the self-fulfilling prophecy nature of some technical trading strategies. For instance, if many traders use a 200-day moving average as a stop-loss level, a price decline to this level could trigger mass selling, exacerbating the downward movement. While this may validate the initial technical signal, it’s unlikely to accurately predict long-term price direction.
In conclusion, while technical analysis can be a valuable tool, its effectiveness can be hindered by market efficiency, the unpredictability of price movements, and the potential for self-fulfilling prophecies.
What’s the Difference Between Fundamental and Technical Analysis?
Fundamental analysis and technical analysis are two primary methods used to evaluate investments. While they both aim to predict future price movements, they employ vastly different approaches.
Fundamental analysis focuses on a company’s intrinsic value by examining its financial health, industry trends, and economic conditions. Analysts scrutinize financial statements, such as income statements, balance sheets, and cash flow statements, to assess a company’s profitability, solvency, and growth potential. The core idea is to determine if a stock is undervalued or overvalued compared to its intrinsic worth. This method is often used by long-term investors seeking to identify companies with strong fundamentals and sustainable growth prospects.
Technical analysis, on the other hand, concentrates on price and volume data to predict future price movements. Technical analysts believe that all relevant information about a security is already reflected in its price. By studying historical price charts and using various technical indicators, they identify patterns, trends, and support and resistance levels. The goal is to anticipate market sentiment and timing entry and exit points. Technical analysis is often employed by short-term traders and investors who focus on market trends and momentum.
It’s essential to note that fundamental and technical analysis are not mutually exclusive. Many investors and traders use both methods to inform their investment decisions. A combined approach can provide a more comprehensive understanding of a security’s value and potential price movements.
Ultimately, the choice between fundamental and technical analysis depends on an investor’s investment horizon, risk tolerance, and personal preferences.
Conclusion
Technical analysis offers a powerful tool for understanding and potentially profiting from market trends. By studying historical price and volume data, investors can identify patterns and signals that may predict future price movements. While not a guaranteed path to success, mastering technical analysis can enhance your trading strategies and improve your chances of making informed investment decisions.
Remember, however, that no method is foolproof, and combining technical analysis with other investment approaches can provide a more comprehensive perspective.


